Smartphone penetration has risen tremendously throughout the world. It is fuelled by economic growth and technological advancements. Today, almost everyone owns a mobile phone. Mobile apps are used for various essential and non-essential tasks. From shopping to checking emails, watching entertaining content, to making payments, there is an app for almost everything.
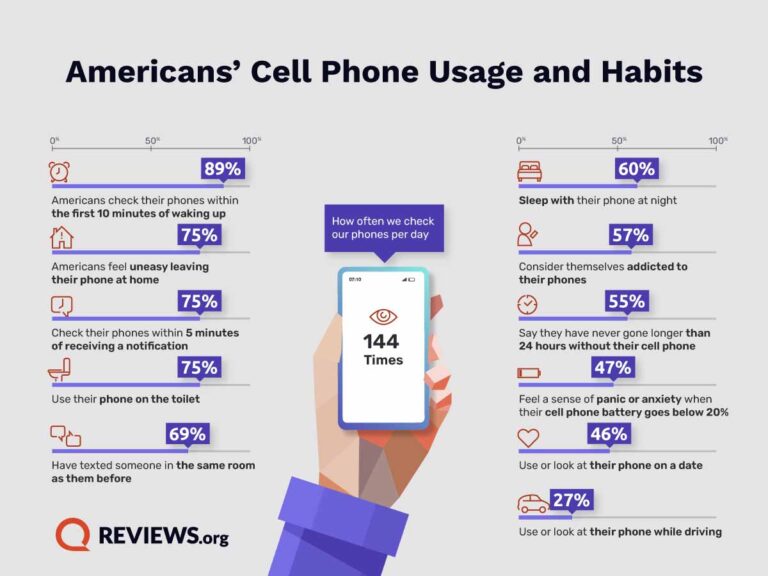
This is great news for businesses as app development presents another avenue to enhance brand reach. The fact that people check their phones around 144 times daily makes investing in feature-rich app development lucrative. However, before that, it is crucial to assess the state of the smartphone app industry and market.
The latest mobile app usage statistics give insights into the general success rates of the apps. The stats also offer a glimpse of what the future of the app industry will look like. All this information will help you create a powerful strategy for app development with the potential for sustainable profits.
Global Trends in Mobile App Usage
Mobile app Trends has been evolving steadily throughout the world. The fact is optimally reflected in the growing number of app downloads and regional usage patterns.
With an average American checking their smartphones every 5 hours and 24 minutes, it is clear how apps have become such a prominent part of people’s lives. The following global mobile app usage statistics showcase the rising number of app downloads and the usage trends in different places.
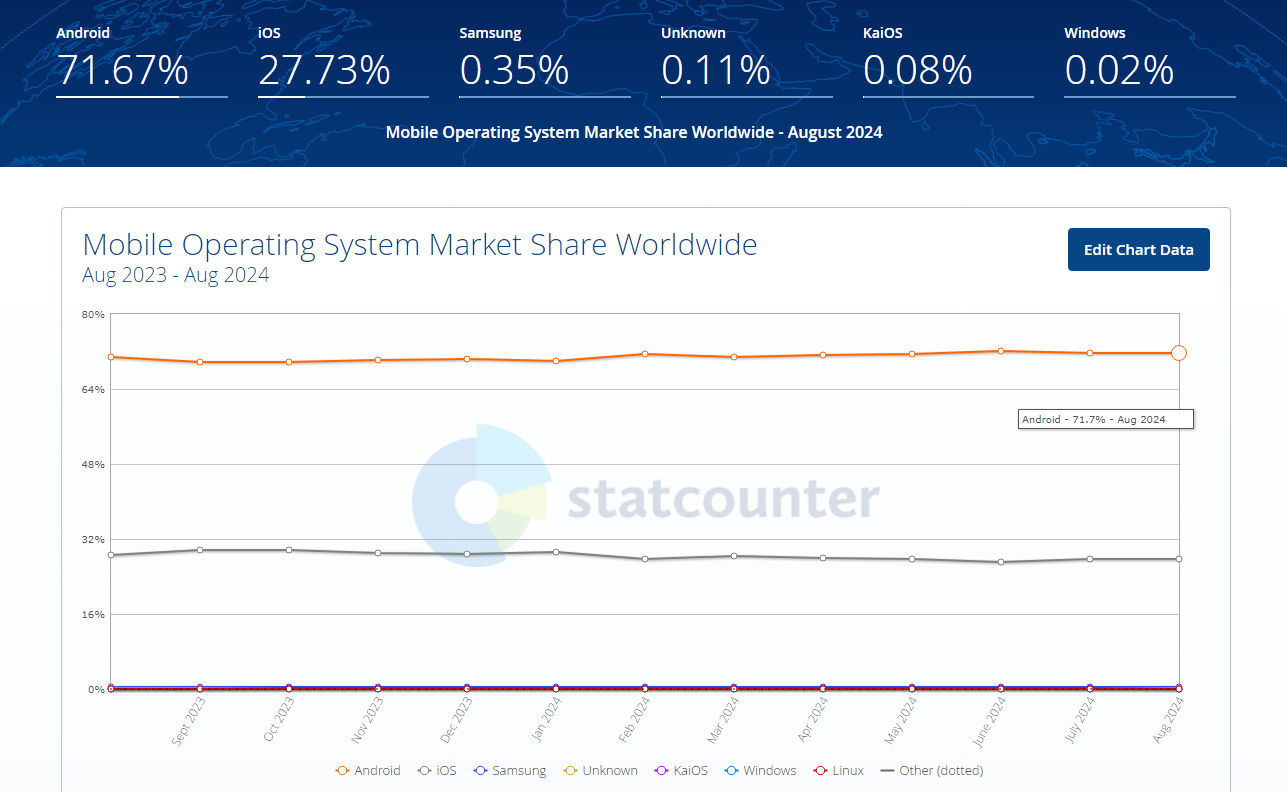
1. Android is the most prevalent operating software and has 71.7% of the market share in 2024.
2. The AI application sector generated a revenue of $1.8 billion in 2023 and is set to hit $18.8 billion by 2028.

3. 233 million users access AI mobile applications, and most use chatbots or photo editing tools.
4. Between 2023 and 2024, ChatGPT was downloaded 209 million times and became the most downloaded chatbot app.
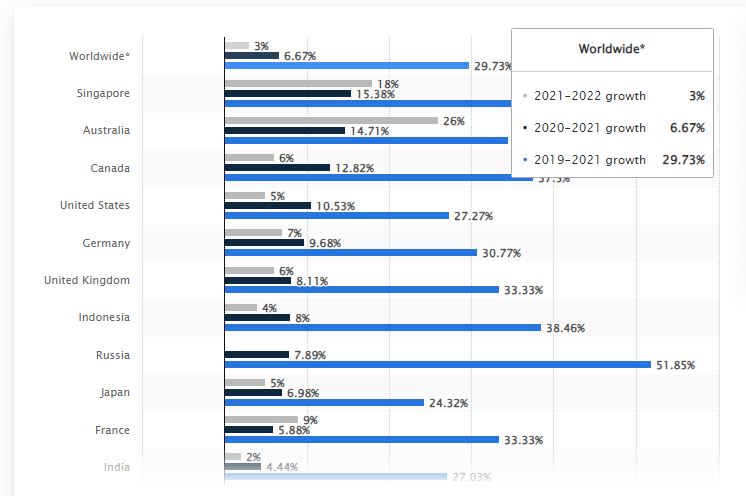
5. Between 2019 and 2022, the time on mobile applications for worldwide users increased by 46%.
6. Between January and May 2024, Candy Crush Saga had nearly 46.9 million downloads across the App and Google Play worldwide. It was the most popular gaming app.
7. The number of apps available to download has risen from 82% since 2016 all over the world.
8. In February 2024, close to 52,000 mobile applications were released via Google Play Store.

9. In 2023, worldwide mobile app downloads reached 257 billion and witnessed a one per cent yearly increase.
10. In February 2024, close to 37,000 mobile apps were released via the Apple App Store.
11. The US is third with regard to total mobile app downloads in 2023.
12. In 2023, China was the leader in mobile apps. The country produced close to 52 billion US dollars in app spending.
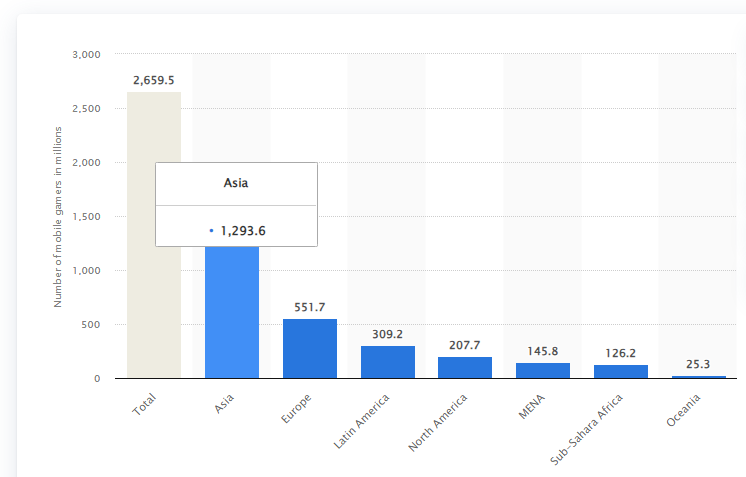
13. Asia-Pacific is the biggest mobile player base internationally, with more than 1.3 billion gamers. This is followed by Europe, Latin America and North America.
The Takeaway
The mobile app usage statistics above point out that people use a variety of Android and Apple apps to complete their daily tasks and are quick to install applications that offer the most convenience. A major example of this is ChatGPT. With the boom in generative AI technology, people everywhere are openly experimenting with AI-powered applications for various purposes.
Besides AI, gaming apps continue to dominate the app stores, as can be seen in the meteoric rise in the downloads for Candy Crush Saga. Also, the huge number of apps released pertain to diverse sectors. It indicates that the market is ripe for new players and that businesses can invest in app development, provided they have a well-researched idea in mind.
Mobile App Usage Statistics for Android Apps
The Android mobile operating system has become an integral element of the smartphone market today. It was initially developed by a company in California with the name Android Inc. In 2005, Google acquired it and shifted the system toward consumer mobile market.
The following mobile app usage stats for Android apps will make many trends clear to you.

14. There are nearly 2,325,565 Android apps on Google Play.
15. Out of the 2,325,565 Android apps on the Google Play Store, 282,518 are gaming apps, and 2,043,047 are non-gaming applications.
16. In 2023, the most downloaded Android apps from the Play Store were Meta’s Instagram, Facebook, and WhatsApp.

17. 4.0 is the average star rating that users have given for all the Android apps on Google Play Store.
18. As of January 2024, nearly 114 thousand apps in the Google Play store have been rated 4.5 stars.
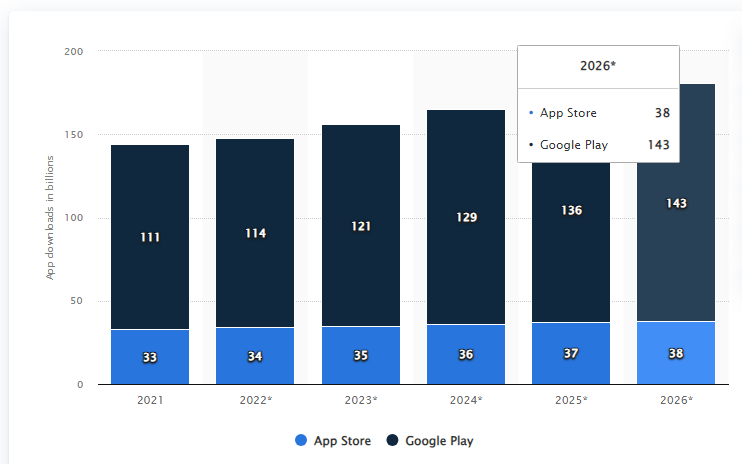
19. In 2026, consumers are expected to download 143 million mobile applications from the Google Play Store.

20. It is believed there will be 7.49 billion users of Android apps on Play Store by 2025.

21. In the U.K, the share of the Android operating system is 55.65%, while that of iOS is 43.85%. Both iOS and Android markets have been close competitors of each other since the first quarter of 2023.
22. Nearly 49% of users of gaming apps on Google Play store are women.
The Takeaway
Android is a vast and adaptable OS that accounts for the variety of apps there. Moreover, Google regularly releases new versions of the operating system, the latest being Android 11, to capitalise on the advanced flagship devices and boost the overall user experience.
From social media and entertainment to shopping, the whopping number of Android apps on Play Store shows the different ways in which businesses are trying to connect with their customers and build relationships. Experienced Android developers will also find Play Store a valuable platform to showcase their knowledge and technical skills.
The popularity of the Android OS for app development is mainly because of the compatibility of apps with a larger number of devices, flexible policy for app inclusion, and the ability of apps to be hosted on third-party websites. Also, the process of getting yourself registered as an Android app developer is a lot easier than an iOS developer. These factors contribute to the increasing popularity of Android OS and, consequently, the use of Android mobile apps.
Mobile App Usage Stats for Apple (iOS) Apps

In 2024, over 1.56 billion people currently use iPhones but this number is not evenly distributed. The Apple App Store has a varying user base throughout the world.
Launched in 2008, the App Store soon became the first commercially successful mobile app marketplace globally. Presently, it connects a huge number of iOS device users to millions of mobile apps and games from developers throughout the world.
Here are some insightful mobile app usage statistics for iOS app development trends.

23. There are 2.08 million apps in the Apple App Store that are available for download.
24. So far, nearly 846,054 publishers have published applications on the App Store.
25. 234,874 iOS apps on the App Store belong to the gaming category, while 1,777,738 are non-gaming apps.
26. There were 9 million iOS app downloads as of July 2024, and Move to iOS was downloaded the most.
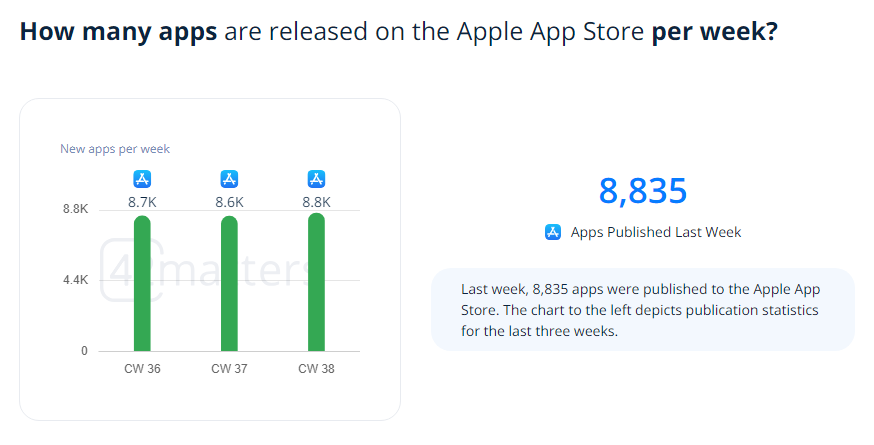
27. More than 8,000 apps are published in the Apple App Store weekly.
28. Gaming is the most popular category of apps in the App Store.
29. Cloud mobile apps are gaining popularity in the App Store. The most popular ones are Google Drive, Dropbox and Microsoft Office 365.
30. The estimated price tag of an iOS gaming app is 0.47 U.S. dollars, while the combined estimated price of apps and games was 0.73 U.S. dollars in January 2024.

The Takeaway
The above mobile app usage stats for iPhone indicate the high availability of applications with every passing year. It is important to note that Apple takes customers’ privacy and satisfaction with the app very seriously. Its user interface is also not as customisable as Android’s. This can explain the relatively low number of Apple apps in the App Store compared to the Google Play Store.
Also Read: Benefits of Creating a Customized Mobile App for your Business
However, the Apple App Store is a close contender to the Google Play Store, which makes iPhone app development a lucrative opportunity for businesses who want to reach a vast audience base who prefer using high-end devices. By choosing the iOS platform, you benefit from the powerful security infrastructure of Apple. The robust security of the app acts as a plus point to gain the trust of a wide variety of iPhone users.
Free Vs. Paid Mobile App Downloads Statistics
One of the essential categories of mobile app usage statistics is free vs. paid apps. Mobile apps play a critical role in people’s everyday lives. However, not everyone is willing to invest in a paid app as opposed to a free one. The fact is made clear with the statistics below.
31. Close to 97% of apps in the Google Play Store are freely available.

32. Android apps on Amazon Appstore that are freely available are around 82%, while paid apps hold just 18% of the total app availability.
33. In the third quarter of 2022, 98% of the overall mobile app revenue was produced from free applications.
34. Presently, the total number of free apps on the Google Play Store is 1,635,665.
35. The total number of paid mobile applications on Google Play Store amounts to 60,562.
36. Close to 37,000 Android apps cost less than one dollar, and 27,000 apps have a price between $1 and $2.
37. 2304 apps are in the price range of $9 to $10.
38. The Apple App Store has 1,915,456 free apps and 96,181 paid apps. However, many free apps are not completely free, as they need subscriptions and in-app purchases.
The Takeaway
The statistics above make it obvious that free apps are preferred more than paid ones. People will install a paid app only if it offers the most unique experience of features that are not found anywhere else. Also, highly trusted brands with a well-established user base can afford to invest in paid app development as they have a higher likelihood of getting good results.
The dominance of free apps in the Play Store is also an indication of the prevalence of the freemium app model. Freemium apps are free to download. They become chargeable only when customers avail of premium services. The shift to this Mobile app Business model also accounts for the growth in Android and iPhone app development.
Statistics on the Most Popular Mobile App Categories
There are over 20 categories of mobile applications. However, only a few are widely known. Apps that come in these categories are the most used and downloaded ones from the Play Store and App Store.
Usually, social media platforms, gaming, shopping and business apps fall into popular categories, as can be seen from the mobile app usage statistics below.
39. According to the latest study, social networking apps like Facebook (59 million downloads) and Instagram (58 million downloads) are the most downloaded ones worldwide. They are followed by the social video app TikTok (46 million downloads).
40. Threads, the micro-blogging platform by Meta, is another popular app that people use and has been downloaded 24 million times.

41. Messaging apps like WhatsApp and Telegram are the second-most popular apps, with 42 million and 27 million downloads, respectively.
42. In April 2024, the top-ranking app with 74% audience reach was YouTube.
43. Gmail was also used by a vast majority of people with its reach climbing to 65% audiences.
44. In 2023, Temu was the most downloaded shopping app and was used massively in the U.S., U.K., Australia, and Canada.
45. In 2022, gaming apps were the most popular in the Play Store and accounted for 13.8% of the available applications.
46. Education and e-learning apps were the second most popular category of apps, with a 10.47% share.
47. Business productivity apps are also quite popular with Google Workspace Marketplace, which has witnessed over 5 billion app installs across its lifetime.
48. Trello, Notion and Evernote are some of the most popular business productivity apps.
49. Health and wellness is another popular category, with apps like MyFitnessPal, Strava and Peloton leading the way.

The Takeaway
The mobile app usage stats above shed light on the popular categories of apps that businesses can explore. The categories that dominate the App Store and Play Store present lucrative opportunities for organisations to deepen their relationships with people and understand what they want.
When more number of people use an app, it ensures maximum engagement. In turn, it boosts your marketing efforts and allows you to widen your reach. As can be seen from the statistics, there is a huge market for social media, gaming and shopping apps. Tapping into these categories with the help of a trusted mobile app development company will make your business more profitable.
Mobile App Retention, Engagement and Churn Statistics
When examining mobile app usage statistics, it is not wise to ignore data related to engagement with the apps. This includes statistics related to retention, frequency of use and churn. People may download your app, but if they do not actively engage with it, the app is hardly in use.
The statistics on user engagement, retention and churn help in understanding the behavior of users and their interaction with the apps. They allow businesses to know how to develop apps that their audience keeps using after installing.
50. In the latter part of 2023, mobile news apps had a retention rate of more than 9% after 30 days of installation.
51. Education apps have a retention rate of less than 2% 30 days post-installation, while social media apps have a 1.37% retention rate.
52. Annual subscription mobile applications have a higher rate of retention, with 28%of users retaining after a year.
53. Only 12% of subscribers of apps with a monthly renewal model are retained after a year of app usage.
54. Apps with a weekly subscription model have the lowest retention rate after a year, which is 3.52%.
55. In early 2023, the retention rate of gaming and fintech apps declined within a day of installation.

56. The rate of churn of iOS apps has increased over recent years. 96.3% of users become inactive after 30 days.

57. The churn rate of Android apps is also high, with 97.9% of users turning inactive after 30 days.

Also Read : Android VS iOS: A Comparison of Distinctive Attributes
The Takeaway
Increased user engagement with an app shows the increasing interest of the user in exploring the functions of the app. Also, a greater level of retention rate is an indicator of the app meeting the needs of the user. If you want to ensure increased retention, pay attention to its UI/UX Design and gather user feedback.
Tailor your engagement strategies according to the interests and likes of users. it helps you maintain the interests of users in your app and prevent them from turning inactive or uninstalling the app altogether.
Mobile App Usage Stats by Age and Demographics
Smartphone use has increased among children, adolescents and individuals in their early 20s. People aged 18 to 24 are particularly active users of apps. App usage also varies regionally. The statistics below give interesting insights into mobile app usage behaviours among men and women of different ages and countries.
58. Video apps are most used by children, with the latest surveys pointing out that American children spend 80 minutes daily on the YouTube app and 50 minutes on the Netflix app.
59. In mid-2022, comics apps on Google Play Store were highly popular among people between18 and 24 years.
60. Nearly ten users of news and magazine apps are in the age group 50 and 64 years.
61. For people in the age group 25 to 34 years, parenting apps held a unique charm in mid-2022.

62. In the App Store, sticker apps registered high engagement in mid-2022 globally by people in the age group 18 to 24 years.
63. Most users in the age group 50 to 64 years used weather apps, while 24% of newsstand apps were between 25 and 34 years old.

64. Most app downloads occurred in China in between the years 2021 and 2023.
65. In 2023, 26 billion app downloads occured in India. It was second to China with regard to the maximum number of downloads.
66. In the U.S., 12.6 billion mobile app downloads happened in 2023.

67. Indonesians spent over 6 hours daily on apps in 2023. This was followed by Thailand (5.54 hours per day), Germany (3.42 hours per day) and Australia (3.35 hours).
68. In mid-2022, auto and vehicle apps on Google Play Store were used by males (92%) more than females (8%).
69. 88 per cent of users of finance and business apps were males, while 48 per cent of those who used parenting apps were females in the second quarter of 2022.
The Takeaway
Mobile app usage statistics by age and demographics in recent years reveal that the younger generation prefers video apps more than middle-aged people. Older people feel more inclined towards weather and news-related applications rather than using their phones to watch video content. The variations in app usage between countries also suggest that people everywhere spend varying amounts of time engaging with apps on their phones.
If you are investing in mobile app development, the stats above will enable you to gain an idea of your target users. Understanding the differences in mobile app preferences and usage between men and women, location and age will assist in launching an app that appeals to your specific target audience or user groups.
Monetization and App Revenue Statistics
Despite the dominance of free apps, the smartphone application industry does generate significant revenue. Google and Apple app stores have become essential streams of profit for the mobile app industry today. Application revenue implies data about earnings produced through various ways, such as application subscriptions, ads, in-app purchases and downloads. The following statistics will shed light on the average money earned by apps.
70. The mobile app market size is said to experience an 11.5% growth from 2020 to 2027.

71. 65% of the top 20 mobile apps, such as TikTok, Instagram, Snapchat, X, Facebook and LinkedIn used in-app purchases and ad revenue streams in 2022.

72. In 2023, the annual app spending produced 171 billion U.S. dollars.
73. Mobile ad spending touched $362 billion in 2023, which was a 7.7% increase from 2022. In the same year, games accounted for 60% of consumer app spending, and the iOS platform was responsible for 66% of spending.
74. In the first quarter of 2024, the overall global consumer spending on mobile applications came to 35.28 billion U.S. dollars.
75. In 2026, mobile app spending will touch 161 billion U.S. dollars on the App Store. It will be 72 billion U.S. dollars on the Google Play Store.
76. It is estimated that by 2027, the spending on the App Store’s apps will be 125 billion U.S. dollars, while the total user spending in the App Store and Google Play will be 186 billion U.S. dollars by 2027.

77. The average revenue generated from a single app download is US$1.86.
78. As of July 2024, the Google mobile app revenue was$338 million. This figure includes $194 million for iOS apps and $144 million for Android applications.
79. In-app advertisements are the preferred monetisation method for revenue generation worldwide. In 2023, this technique generated 307 billion U.S. dollars of revenue.
80. In 2023, DouYin and TikTok yielded the most revenue in Apple App Store globally. DouYin produced 372 million U.S. dollars and TikTok generated 324 million U.S. dollars in revenue.

The Takeaway
The statistics above clearly indicate that the mobile app market is huge and produces millions of dollars of revenue each year through free and paid apps. It is highly likely that the global app revenue will soon reach a figure of a trillion with the increased internet usage and the continued popularity of gaming apps.
Furthermore, free apps based on the freemium Business model constitute a big source of income in the Google Play Store than App Store. If you want to diversify your revenue streams, it would be wise to use a combination of in-app purchases and advertising, just like TikTok, Instagram and Snapchat.
Conclusion
The mobile app usage statistics in this article clearly reveal the increasing appetite of people, especially those aged 18 to 24, to explore interactive apps. We can also safely say that the app economy is booming, which, in turn, is bringing new opportunities for businesses to interact with their audiences.
However, it is necessary to embark on mobile app development after thorough research on your target demographics. Knowing their behaviours, preferred operating systems, and likes and dislikes will help you create apps that fulfil your revenue goals. Including features that offer a personalised experience will increase the retention rate and boost profitability.
If you plan to develop an app this year and want a trustworthy technology partner, feel free to contact eSparkBiz’s experts.


